Revisiting GA4 - Answering Ten of the Most Common Questions
In the fast-paced realm of digital analytics, staying abreast of the latest updates is pivotal for making informed, data-driven decisions for your business. Google Analytics 4 (GA4) has introduced significant changes, and in this follow-up to our GA4 Webinar: The Good, The Bad, and The Ugly , we’ll delve into key features, addressing common questions to guide you in navigating and optimizing your analytics strategy.
Let’s kick off by breaking down the essential points and providing a high-level overview before getting into a detailed breakdown.
An overview of what we’re going to cover in GA4
Content Performance
- The explore section replaces Content Drilldown report.
- Create reports using “page path and screen class” for grouped page performance.
- Custom content groupings can be set up via Google Tag Manager (GTM).
Landing Page Issues
- (Not set) landing pages indicate GA4 configuration problems.
- Troubleshoot with GTM and Chrome Dev Tools to ensure essential events fire correctly.
Google Ads Metrics
- Link Google Ads to GA4 for comprehensive performance metrics.
- Utilize user acquisition reports and customize dimensions for detailed campaign and keyword data.
Sessions and Engagement
- Evaluate session totals and engaged sessions in Traffic Acquisition and User Acquisition reports.
- Engaged Sessions defined by duration, conversions, or multiple screen/page views.
Bounce Rate Alternatives
- Bounce rate replaced by metrics like Engaged Sessions, Engagement Rate, and Average Engagement Time.
Custom Dashboards
- Create custom dashboards within the explore tab, on the “Report Snapshot Report” page, or in Google’s Looker Studio.
Direct Traffic Spike Causes
- Investigate UTMs, redirects, bot traffic, GA4 implementation issues, and traffic from “dark” social platforms.
Filters and Dimensions
- Limited filter options categorized as Developer Traffic and Internal Traffic.
- Dimension drill-down remains, with some limitations.
Multi-Channel Funnel Report
- Data-driven model differs from UA’s non-direct last touch model.
- Utilize the conversion comparison chart for evaluating different attribution models.
Conversion Events in GA4
- Goals and eCommerce transactions are now called “Key events.”
- Key events are crucial KPIs for understanding website performance and marketing channels.
Detailed breakdown of 10 common GA4 questions
1) How do I see my top-performing content on my website? I used to look at the Content Drilldown report in GA – where is it in GA4?
Being able to view the performance of your web pages helps you understand how the content you are creating is performing on your website, and what possible categories you should expand on to grow your audience & leads.
With extra configuration, it will be less than ideal to see your page performance by groupings. You can create a report in GA4 using the explore section and add “page path and screen class” which will provide the performance of pages by their folder or subfolder, like for example:
- /about-us/
- /team/
- /blog/
If you would like to create a custom content grouping, you can create that with the help of GTM. Check out the video below for help on getting grouping set up.
Creating Content Groupings
2) Why am I seeing (not set) as some of my top landing pages?
Typically, a (not set) landing page indicates an issue with the GA4 configuration. Oftentimes, the event to indicate the start of a session “session_start” or the page view event “page_view” did not fire. These events collect the data you see in GA4 landing page report.
To get started, I would test your GA4 implementation using GTM and the DebugView helper in GA4 settings. If you don’t have access to that, I would use Chrome Dev Tools to show you what events fired when you loaded a landing page.
Debug Landing Page Issues
3) How do I see specific advertising data, like the Google Ads campaign and keyword data GA used to show? What about searching by a specific UTM?
Google Ads performance reporting in GA4 is a great way to view more performance metrics than just click-based ones that Google Ads provides. GA4 provides metrics that help you tell a story of the user’s journey after they click your ad.
To get things started to make sure you’re on the right track, I recommend that you first make sure you are linked from Google Ads to GA4. Once that is linked, you will be able to report Google Ads data within GA4.
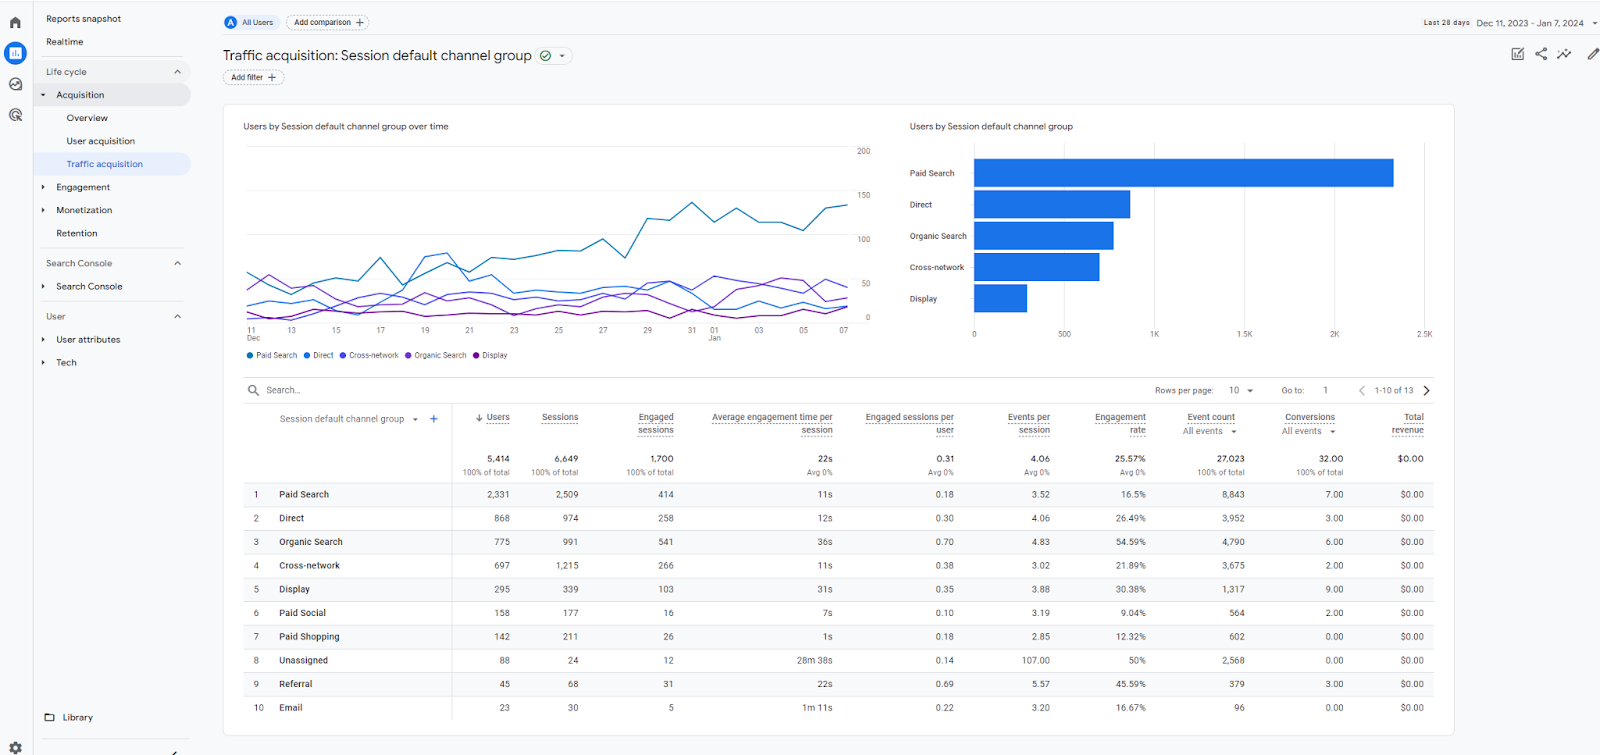
When you are in GA4, navigate to the user acquisition or traffic acquisition report, depending on what metrics you’d like to see. You can then change your primary dimension to be “Session Google Ads Campaign” or “Keyword Text.”
4) How can I see sessions in GA4?
Sessions are a key metric in being able to identify how your website has been performing.
You can see session totals in the Traffic acquisition report, under the “Life Cycle” report focus. GA4 introduced “engagement metrics” which are a great way of telling the quality of your site traffic. You can see “Engaged Sessions” in the User Acquisition report. Engaged Sessions are sessions that:
- The number of sessions that lasted longer than 10 seconds, or had a conversion event, or had 2 or more screen or page views.
5) Can I still generate a bounce rate report in GA4? If not, is there an equivalent?
Bounce Rate is a thing of the past with GA4. GA4 is built on an event-based data model, and bounce rate was a binary yes/no metric that really only worked with Universal Analytics data model. In GA4, multiple events are scored to provide you with an insight into the quality of the traffic. I would focus on these metrics in GA4 instead of bounce rate:
- Engaged Sessions
- The number of sessions that lasted longer than 10 seconds, or had a conversion event, or had 2 or more screen or page views.
- Engagement Rate
- The percentage of engaged sessions (Engaged sessions divided by Sessions).
- Average Engagement Time
- The average length of time that the app was in the foreground, or the website had focus in the browser.
Understanding GA4 Metrics
6) Can you make custom dashboards in GA4?
Yes you can! Creating customer dashboards can help you organize your website performance data more easily and quickly than loading GA4 every time you want to view certain metrics.
To get started creating your own customer reports in GA4, check out these recommendations:
Not Preferred
Creating a report within the explore tab of GA4.
Better
Creating a customized report visual snapshot on the “Report Snapshot Report” page.
Best
Port your data into Google’s Looker Studio and visualize there.
7) Why does it seem Direct traffic has spiked so much in GA4 compared to UA?
GA4’s data collection relies on a few instruments for it to accurately report the source & information attributed to a user or session, which can lead to more discrepancies. Here are some of the reasons for an increase in GA4 direct traffic:
- UTMs: You haven’t correctly attributed UTMs for your marketing campaigns.
- Redirects: Your UTM’d traffic is redirected from your LP to something else which strips the UTMs and passes data as direct.
- Bot traffic: This isn’t that common but can still happen. You’ll find most of this bot traffic is coming from one central place in the world.
- You don’t have GA4 on every single page of your site.
- You have a lot of traffic coming from “dark” social sharing platforms, like Discord, WhatsApp or Facebook Messenger.
- You have a lot of visitors who visit directly via manual URL entry or bookmarks.
8) Do filters and dimension drill-downs still exist in GA4?
They do! Dimensions and filters are two key aspects of GA4 that’s important to understand how they work as they have a clear point to play in how you organize your data.
- Dimension drill-down is still similar to UA where you can change your dimension in standard reports and add a secondary dimension. There may be more limited dimension options because of how GA4’s data model works but the options are there.
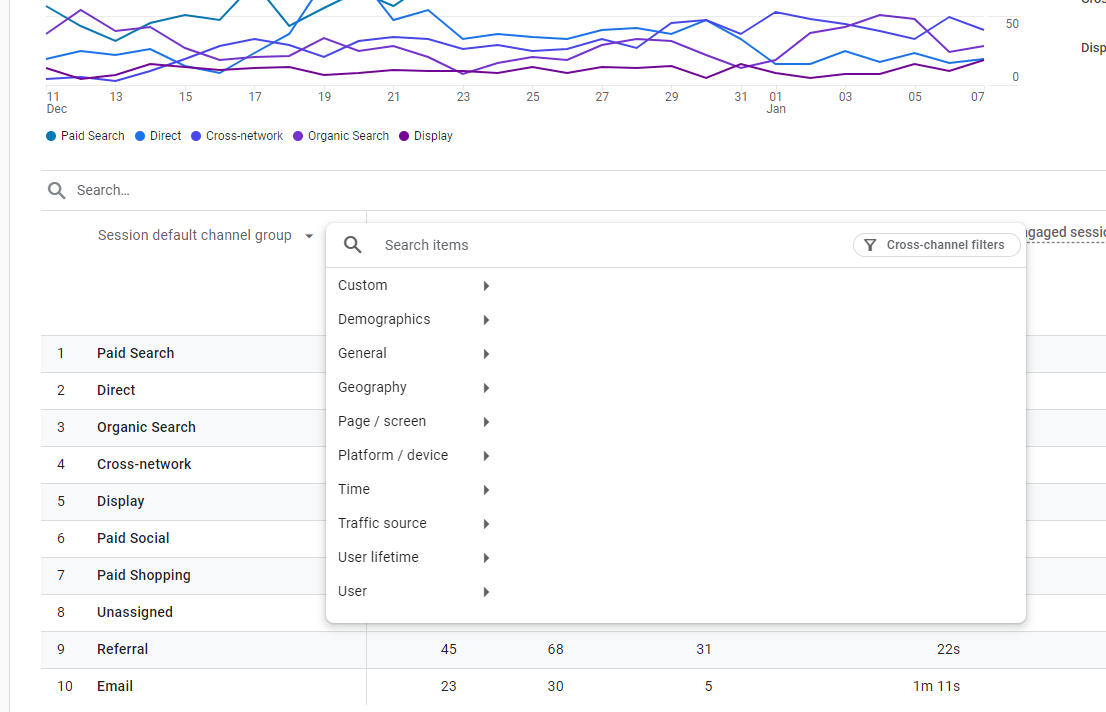
- Filters have changed, and you have less options with the filters you want to create. They are currently in two categories:
- Developer Traffic: Filter out activity from developers who use debug mode
- Internal Traffic: Filter out users with an IP address or range of IP addresses (This one is the most common)
Some of the filter reporting you may of really liked in UA like “Search and Replace” is extinct but may be possible through your GA4 implementation via gtag or GTM.
Understanding Data Filtering
9) How does the multi-channel funnel report, specifically the assisted conversions report, work in GA4?
Since GA4’s default data model is “data-driven” it is a bit different than UA’s non-direct last touch data model. In the “Advertising” section of GA4, you can see your conversion paths as well as a model comparison. You are still able to utilize the conversion comparison chart to compare your different data models for attribution to determine their effectiveness. Direct traffic has been removed from reporting unless the entire purchase funnel happened solely on direct.
10) Universal Analytics, there used to be Goals and eCommerce transactions. Now these are all grouped as conversion events in GA4. Help me make sense of this.
They say two things are better than one. But when it comes to reporting and understanding your data in GA4, the one thing to know is that goals or “key events” are GA4’s key KPI to help you make sense of your performance by marketing channel.
Goals in GA4 were named “conversions” since the beta launch but recently, Google announced that “conversions” in GA4 will be called “Key events.” Your key events are events that you’ve deemed to be important, such as a lead form fill or purchase.
When it comes to eCommerce, you will be able to see all transaction data still within the monetization report of GA4.
By adapting to the changes in Google Analytics 4, you empower yourself with more robust insights and a deeper understanding of your website’s performance. Follow the tutorials to optimize your configuration and make the most of GA4’s advanced features.
Questions?
If you have any questions or are interested in having Granular help grow your business, please use the button below to get in touch!
Related articles on GA4