How to Create Custom Reports with Google Ads Extensions for Google Sheets
Have you ever needed to pull specific data from Google Ads for analysis or client reporting, only to find that Google Ads just didn’t have the report you were looking for? You’re not alone and we are here to help!
The Google Ads Extension for Google Sheets is free, easy-to-use add-on allows you to create custom reports, apply filters, and design data visualizations that are tailored to your goals. In this post, we’ll guide you step-by-step on how to install and make the most of this powerful tool.
How to Install the Google Ads Extension for Google Sheets
Getting started with the extension is straightforward. Here’s how to set it up:
- Open Google Sheets: Start with a blank sheet.
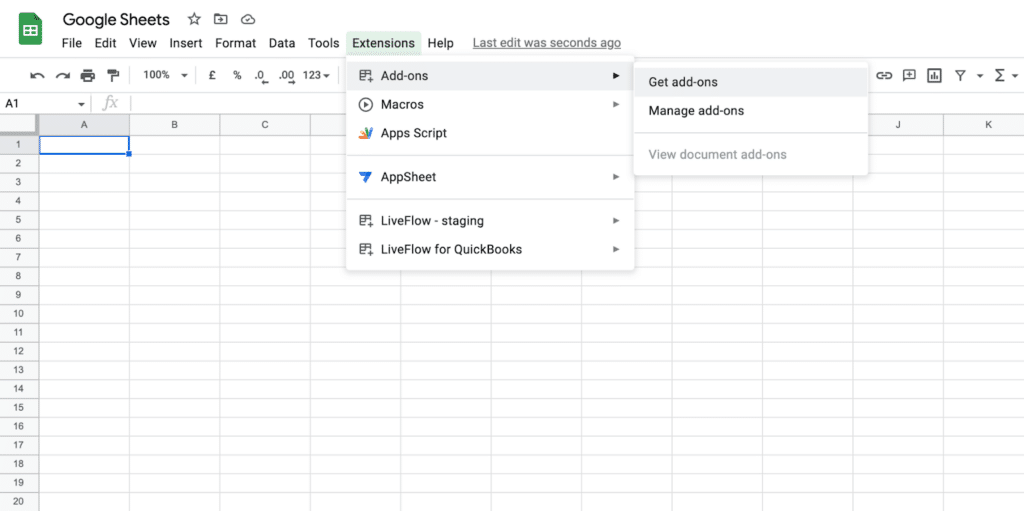
- Navigate to Extensions: Click on Extensions > Add-ons > Get Add-ons.
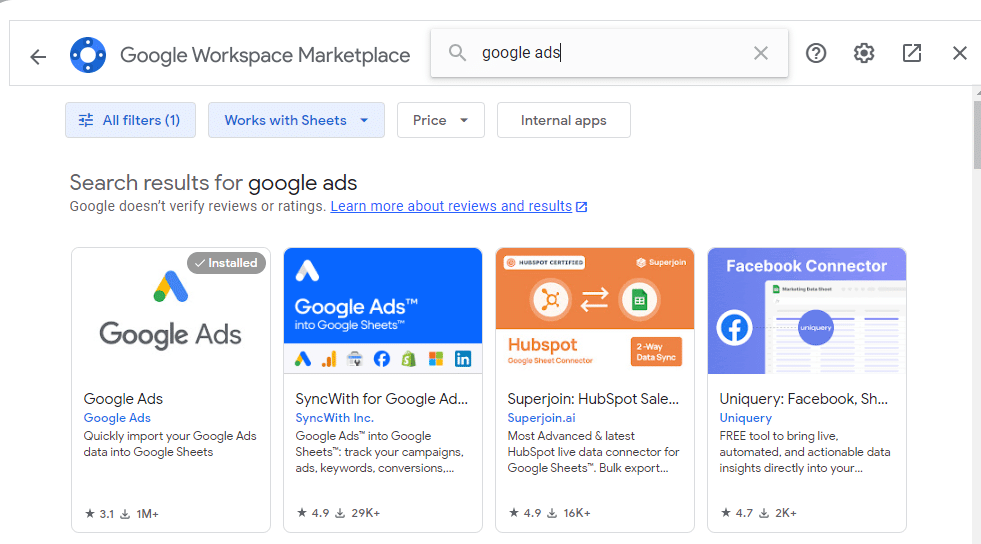
- Search for Google Ads: Type “Google Ads” in the search bar and install the extension.
Once installed, you’re ready to begin building custom reports!
Creating Your First Custom Report in Google Sheets
With the extension in place, follow these steps to generate a report that meets your unique needs:
- Open the Add-On: Go to Extensions > Google Ads > Create New Report.
- Select Your Google Ads Account: Choose the account you want to pull data from.
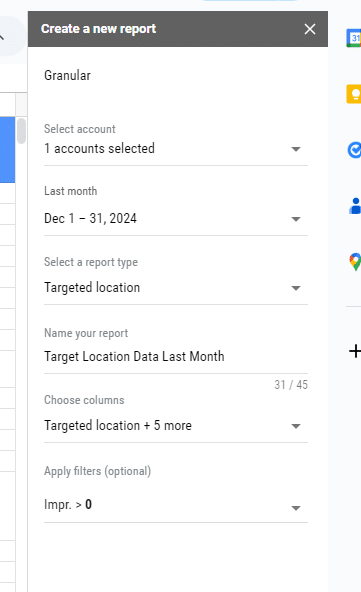
- Customize Your Report:
- Date Range: Pick the desired time frame (e.g., “Last Month”).
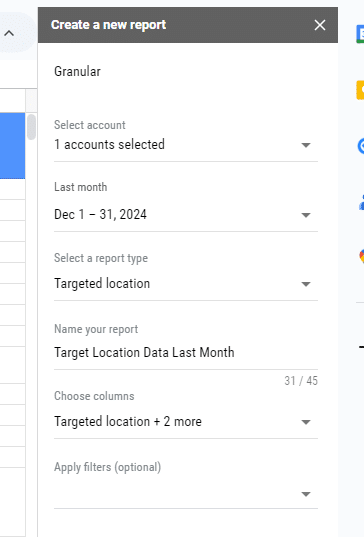
- Report Type: Choose a focus, such as “Targeted Location.”
- Report Name: Assign a descriptive name like “Target Location Data – Last Month.”
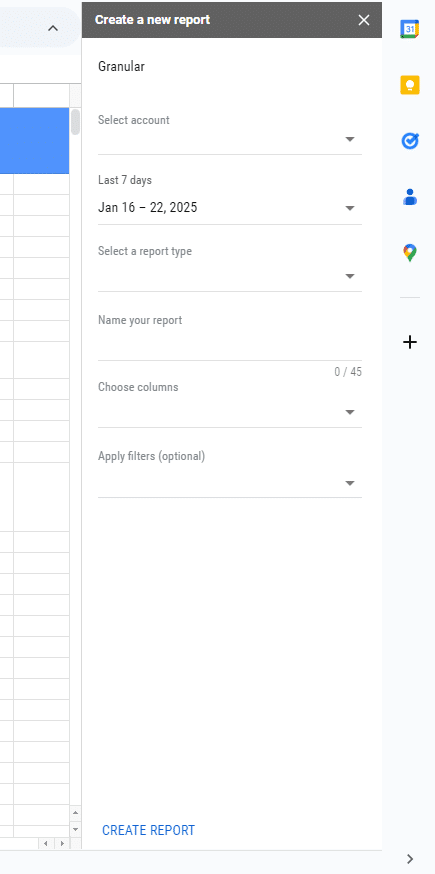
- Adjust Columns and Filters: Tailor the data to your goals by:
- Including columns such as conversions, clicks, and cost-per-conversion.
- Applying filters to exclude irrelevant data, like locations with no impressions or specific campaigns.
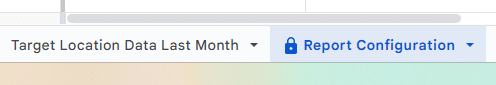
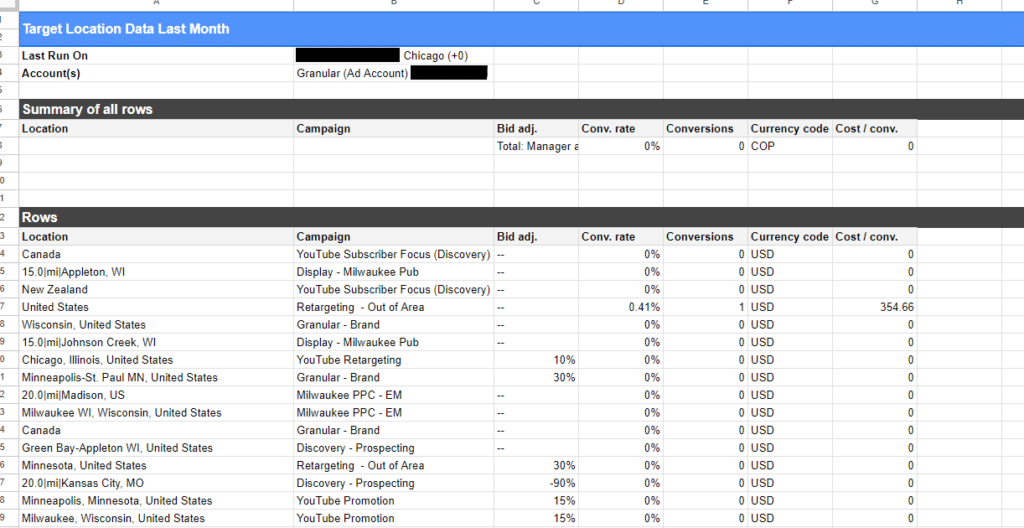
- Generate the Report: Click “Create Report” in the sidebar. The tool will generate two tabs in your spreadsheet:
- A data tab with your requested information.
- A report configuration tab for reference.
Visualizing and Optimizing Your Data
Now that you’ve got your custom data in Google Sheets, here’s how to make the most of it:
- Format and Analyze: Use Google Sheets formulas to format the data for easy interpretation.
- Visualize Trends: Create charts or graphs to spot key patterns and performance insights.
- Iterate and Improve: Revisit the Google Ads Extension to edit or create new reports within the same workbook.
Why Use Google Ads Extensions for Reporting?
This tool is a game-changer for marketers and business owners. Instead of relying on generic reports, you can:
- Tailor data insights to your campaign objectives.
- Save time with automated, repeatable workflows.
- Empower yourself or your clients with actionable visualizations.
The Google Ads Extension for Google Sheets offers a seamless way to customize, visualize, and optimize your advertising data. Whether you’re analyzing last month’s performance or preparing detailed client reports, this tool simplifies the process and provides unmatched flexibility.
Take control of your data today by installing the Google Ads Extension, and let your creativity guide your next campaign analysis.
Questions?
If you have any questions or are interested in having Granular help grow your business, please use the button below to get in touch!