Improving Advertising Efficiency, Part Two: Measuring Incrementality
Part 2 of 2. To read the first installment, Improving Advertising Efficiency, Part One: Understanding Incrementality, click here!
Using Geo Experiments for Incrementality Measurement
In part 1 of this article we defined incrementality measurement, the problem it attempts to solve and a common scenario in digital advertising where it is needed.
This article will focus on how to do it and other scenarios where incrementality measurement can be deployed to optimize advertising effectiveness.
Our scenario in part 1 deals with the common situation that digital marketers face when managing multi-channel campaigns in Google and Meta and there is double counting of conversions and revenue; a situation that makes decisioning around budget allocation between platforms difficult.
While all ad platforms are generous to themselves relative to claiming credit for conversions and revenue, middle and upper funnels platforms like paid social and programmatic tend to be the most generous because 1) their conversions are primarily view- rather than click-based, and 2) they use lookback windows that can erode confidence in causality. Furthermore, post Apple iOS 14.5 and App Tracking Transparency (ATT) in spring 2021, social media apps began “modeling” conversion reporting due to the majority of users opting out of app tracking.
Beyond Last Click Attribution
Sophisticated marketers understand that reliance on last click attribution and lower funnel channels is inherently self-limiting. Growth requires cultivation of awareness and interest across new audiences, hence allocating spend to “upper funnel” channels like paid social, programmatic and offline is essential. Knowing how much and where to allocate to each of the myriad of media options available can make the difference between marketing success or failure.
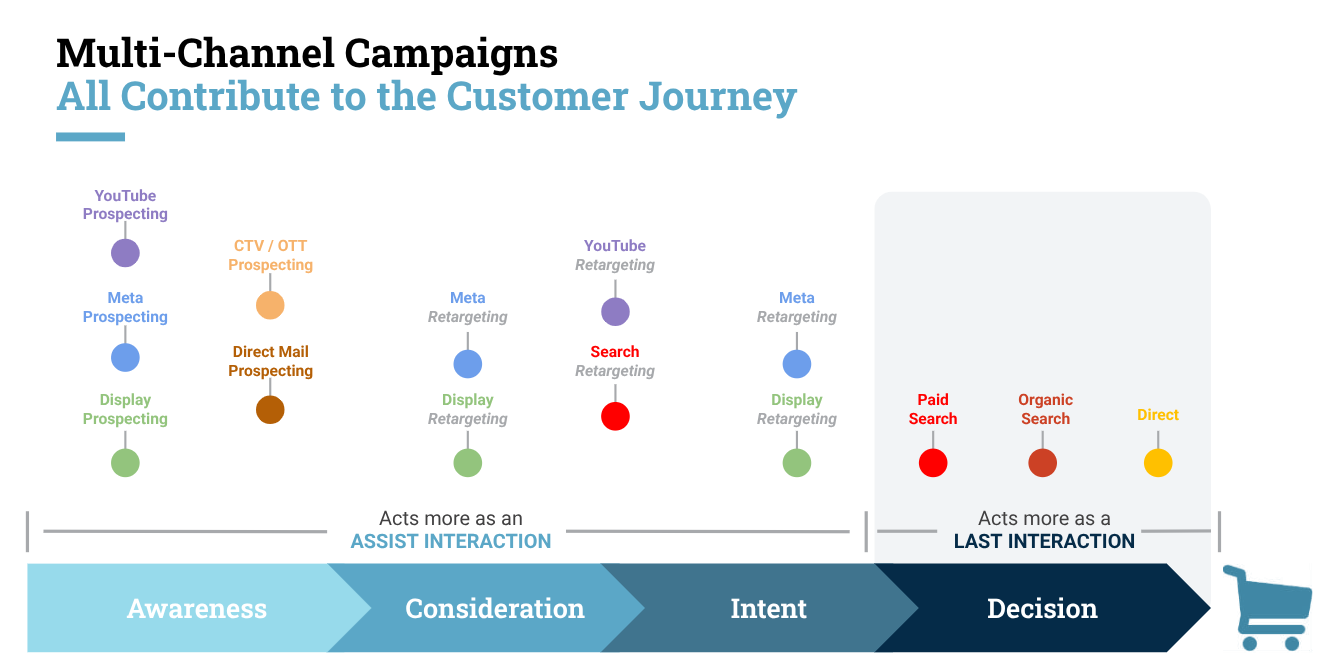
The key to optimal allocation across the funnel is holistic measurement: beyond platform, beyond last-click and beyond web analytics. What every marketing leader (and their CFO) wants to understand is where to spend the next dollar to maximize growth. This is where incrementality measurement comes in.
Geo experiments for Incrementality Measurement
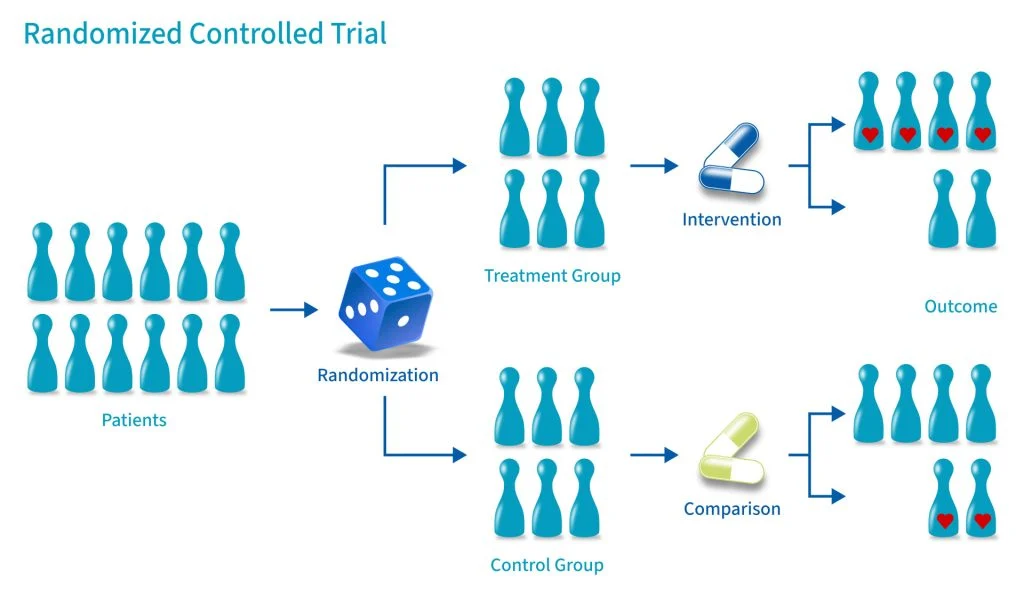
Geo experiments are based on the gold standard of scientific testing, the randomized control trial (RCT). The RCT quantifies the impact of a “treatment” across two randomized groups that share similar demographics. One group receives the treatment, the other a placebo and neither knows what group they are in, a so-called “double blind trial”. Any change in the treated group is measured and if the change is found to be statistically significant, the change is then attributed to the treatment. For marketing measurement, the RCT model is applied in the form of the geo experiment.
For geo experiments, randomized groups are geographically determined “matched markets”, markets that as much as possible share similar characteristics for a particular business. To minimize bias that might skew results, multiple factors such as historical sales volume, population-to-sales ratio, competition, store distribution, retail distributors, competitors, other media buys, and more are considered when choosing matched markets. Creating matched markets that rise to the level of the randomization achieved in scientific RCTs is non-trivial. To assist with this process, Google has made a Python library for design and analysis of Geo experiments using Matched Markets and Time Based Regression available on GitHub.
How to Run a Basic Geo Experiment
Once matched markets are determined a hypothesis must be written and approved by all interested parties. A hypothesis formalizes the experiment with an informed, testable prediction that upon validation or invalidation, will guide future actions.
In the case of our scenario, our hypothesis looked like this:
While Meta’s in-platform reporting clearly overstates performance, we believe that it makes a meaningful incremental contribution to overall sales. To test this we will focus our current Meta ad budget in 5 states for 30 days and measure the difference in sales (both web and total) between the states where Meta is running vs the holdout. We will use this result to help calculate a budget for an expanded test that verifies our first result and ultimately leads us to spend levels on Meta that generate incremental ROAS aligned to our overall ROAS goal.
Promising Results
The results of the geo experiment showed a 24% increase in web revenue and a 28% increase in overall revenue from the states where Meta ran vs. the states where it didn’t, a strong and statistically significant indication that Meta drives upper funnel activity that translates to sales and revenue growth that wouldn’t have happened without it. In short, the geo-experiment showed that Meta is indeed causing incremental sales.
The next task is to test Meta budgets across all states that reach the point of diminishing incremental return. Our structure for this experiment divides states equally by a population-to-sales ratio and running the BAU daily budget in group A and 2X the daily budget in group B. From this experiment we will calculate incremental return on ad spend.
Example calculation of incremental return on ad spend (incremental ROAS)
- Control group sales BAU Meta budget: 10,000
- Test group sales with 2X BAU Meta budget: $25,000
- Incremental sales : $15,000
- Incremental Ad spend: $5,000
Calculation: iROAS = $15,000 (incremental revenue) / $5,000 (ad spend) = 3.0
Next Level: Incrementality Testing Platforms
The example above demonstrates how a relatively small ecom brand can use the principles of incrementality and the modality of geo experimentation to optimize a simple media mix. For larger brands with big budgets both online and offline, the stakes are higher, making the number of tests and velocity of learning more urgent. To address this need, a number of third party incrementality measurement platforms have emerged in recent years, providing faster and more precise ways for brands to find the optimal media mix.
Perfect marketing measurement, while an admirable goal, just isn’t possible. But getting better is. Having an incrementality mindset and embracing incrementality testing, either through geo experiments or a third party platform is the way forward and the way you can, as the “Incredible Incrementalist” Avinash Kaushik once said, become “less wrong.”
To figure out the real value of Meta’s ads and decide on the right budget, we needed to measure incrementality. The gold standard way to test this methodology in marketing is the Geo Experiment. So to round this out, in Part 2, we’ll explain how to use Geo Experiments to measure incrementality and how they can help you make better decisions about your ad budget.
To read Improving Advertising Efficiency, Part One: Measuring Incrementality, please click here!
Questions?
If you have any questions or are interested in having Granular help grow your business, please use the button below to get in touch!