Using the Modern Portfolio Theory for Paid Search
Paid search is basically the stock market. They both boil down to making investments to maximize return hopefully with a minimum amount of risk. By investing more time into important economic theories, we can better figure out how to optimize returns and lower overall risk.
Modern Portfolio Theory is one of the most important and influential economic theories dealing with finance and investment. It argues that a portfolio can maximize returns by optimizing risk through diversification. Diversification is something that is already innately done in paid search. It is why an account is built out with multiple keywords instead of one keyword. It’s why we often recommend expanding accounts into Facebook, LinkedIn, Bing, etc. instead of just keeping an entire budget in Google.
Diversification is an easy solution to mitigate risk. But to optimize risk, we need real measurement. This is where Modern Portfolio Theory comes in. It doesn’t just argue for diversification, it also puts math to work to find the right combination of assets that will maximize overall returns and lower risk
Let’s use a real example of a client that has both Search and Shopping.
To calculate the best way to divide the budget, I took the overall return on ad spend (ROAS) for both search and shopping since 2014. Then I took the standard deviation between every month’s ROAS. Then you find the correlation between Search and Shopping’s ROAS.
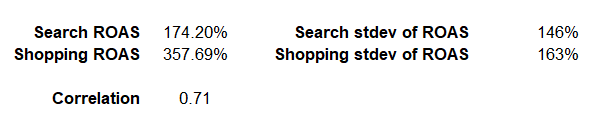
Then we run these numbers through every budget scenario between the two networks (search 10% of budget/shopping 90% of budget, search 20%/shopping 80%, etc.) to calculate the portfolio’s standard deviation and expected ROAS.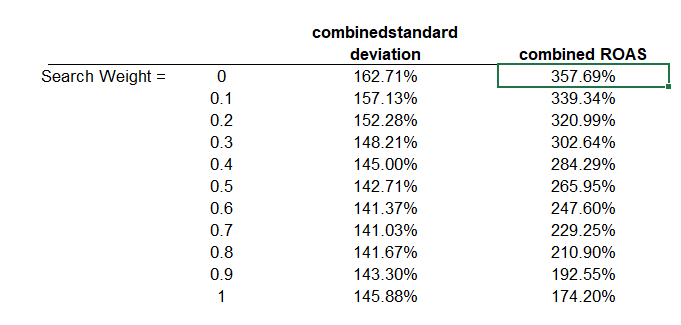
We calculate the combined standard deviation by taking the square root of the individual standard deviations squared added together plus the two times the standard deviations times the weights times the correlation.
We can calculate the combined ROAS by taking the weights times the ROAS.
Those numbers will turn out the following graph:
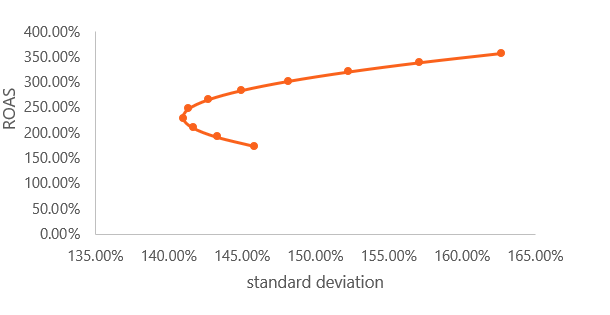
The space within holds every possible combination of risk and return possible. The upper part of the parabola represents the best possible returns for a given risk level.
The data points to shopping needing to be at least 40% of the budget to efficiently maximize returns.
This kind of analysis is something that can be done for anything regarding paid search. It can be used to determine the best way to budget for keywords, tactics, platforms, etc. And more than two assets can be compared. The math gets more complex, but the principles stay the same.
So why is this important?
Because there is risk that can’t removed at all. This is called systematic risk. Systematic risk is everything in the world that can’t be controlled. Specifically for paid search, systematic risk can refer to the rise of machine learning tools like responsive search ads or Target ROAS. While these new machine learning tools can create more value, they are inherently riskier.
That means you have to get better at optimizing for the risk you can control. For paid search, removing risk includes negative keywords, creating new ads, etc. But you’ll never be able to truly optimize for risk without optimal diversification.
