Industrial B2B Conversion Rate and CPC Trends
When reporting on campaign data, especially with newer clients, we often get some form of the question “Are these numbers good?” or “How does this performance stack up compared to other people in my industry?”
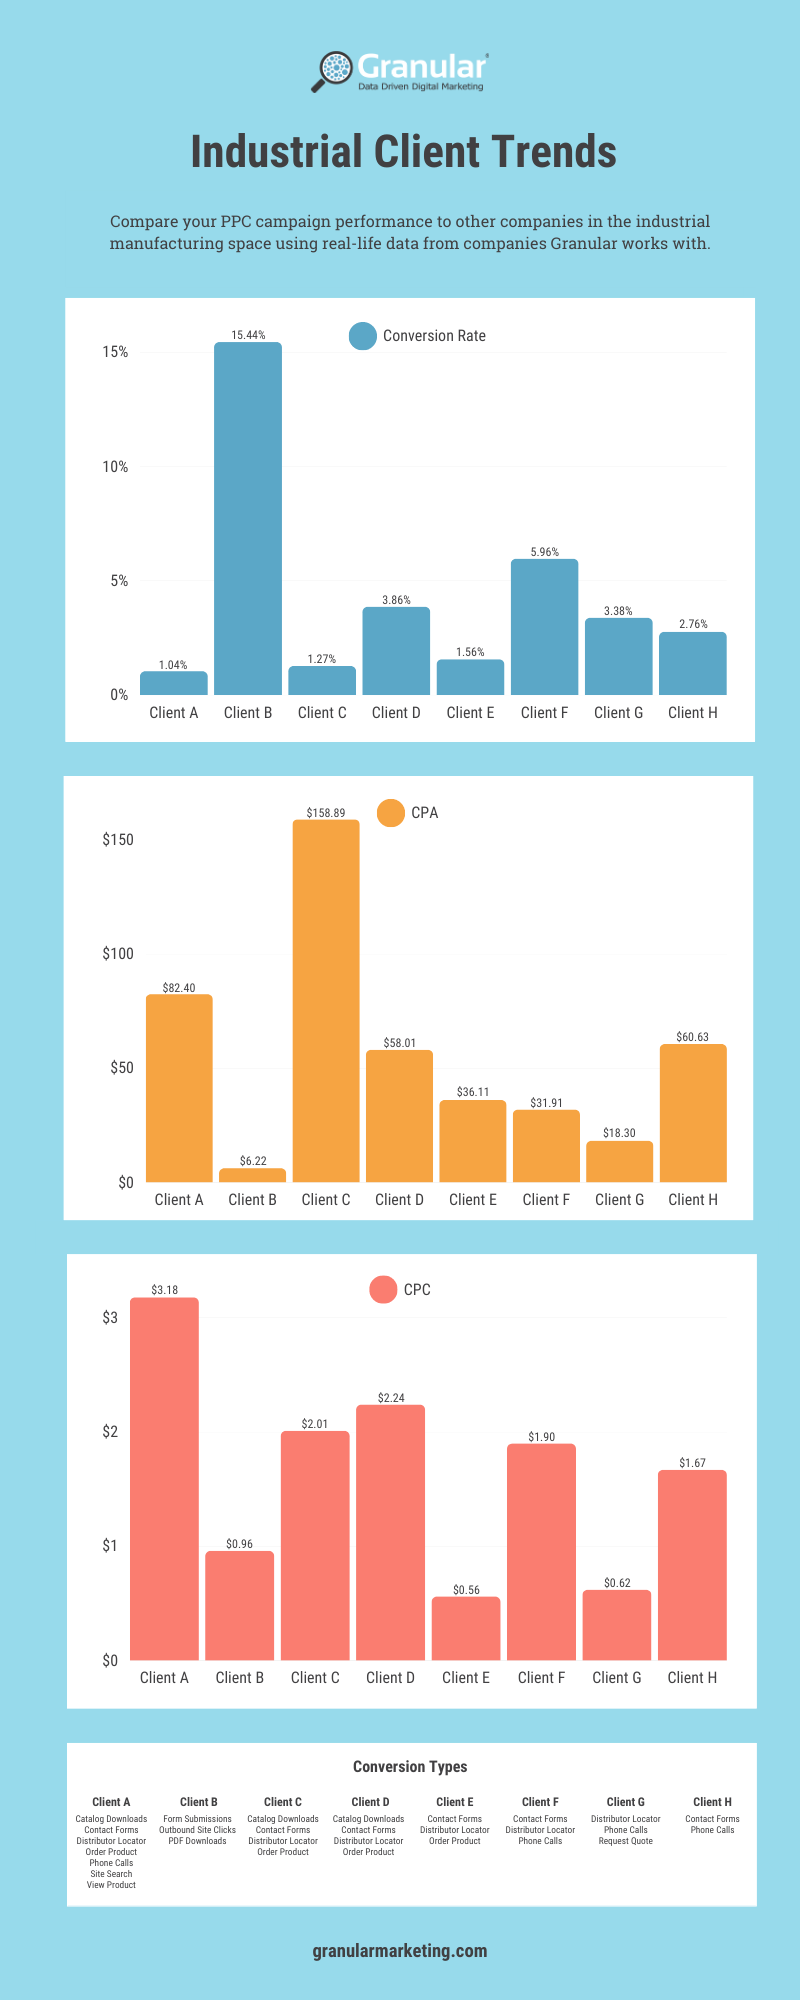
These clients, while all in the industrial/manufacturing space, vary greatly in account size & scope. Their ad spend ranges from $1,200 to $250,000 per month and they have different overall business goals from their Google Ads campaigns.
What B2B Conversions Really Matter?
To put all of these numbers into further context, when evaluating performance, success will always come down to your aforementioned business goals and the value of each lead you are getting. Take, for example, Client B in this chart. Yes, their conversion rate seems astronomically high when compared to the rest of these clients, but one of their main conversions is a PDF download. That is generally going to be of a much lower value than Client E, where the conversion points are more focused on the lower funnel (Contact Us, Placing an order, etc.) Generally speaking, we typically aim for a conversion rate in the 2-3% range, with the goal always being consistent improvement.
For those of you in the industrial/manufacturing sectors, worry no more! You can now compare the performance of your campaigns with that of other clients. We’ve anonymized the clients’ names but provided some additional context by including the conversion types that we track that go into their Conversion Rates and CPA. Check out our infographic below & be sure to bookmark this page to reference the next time you are curious about your competitors’ performance!

